
Power BI is an incredibly useful data analytics and visualization platform. With it, business users can create reports and dashboards from otherwise meaningless data records.
These reports and dashboards are interactive and can be shared with team members. This makes Power BI a loved tool in business intelligence.
In this article, I will demonstrate how to integrate Power BI with Python – another popular programming language used for data analytics.
Why Integrate Python in Power BI
Python is a popular programming language that is relatively easy to learn and therefore preferred by data analysts or other professionals who want to write code without being full-time programmers. Integrating it into Power BI carries a number of advantages, such as:
- Data can be imported programmatically using APIs. This is useful when integrating different systems together, such as user database systems with Power BI for real-time usage analytics.
- Data can also be visualized in more ways than Power BI natively supports. The Python integration into Power BI enables you to create custom visualizations using libraries such as Matplotlib.
Also read: Microsoft Power BI Data Analyst Certification (PL-300): How to Get it.
Without further ado, let’s get into how to integrate Python in Power BI.
How to Integrate Python in Power BI
Power BI Desktop only runs on Windows. Therefore, for this guide, I am going to be assuming you are doing this on a Windows machine. To integrate Power BI with Python, you will need to follow the steps outlined below:
Install Python
First, you need to install Python on your machine. Installing Python is easy. You simply have to go to the official Python download page and download the installer. With the installer downloaded, run it, making sure to add it to your environmental variables. If you are not sure how to do that, here’s a helpful video to guide you.

Install Power BI
This part is somewhat obvious. To integrate Python into Power BI, you need to have Power BI installed. For this demonstration, we are going to be using the Desktop version. This can be done by first visiting the official Power BI download page and downloading the desktop version.
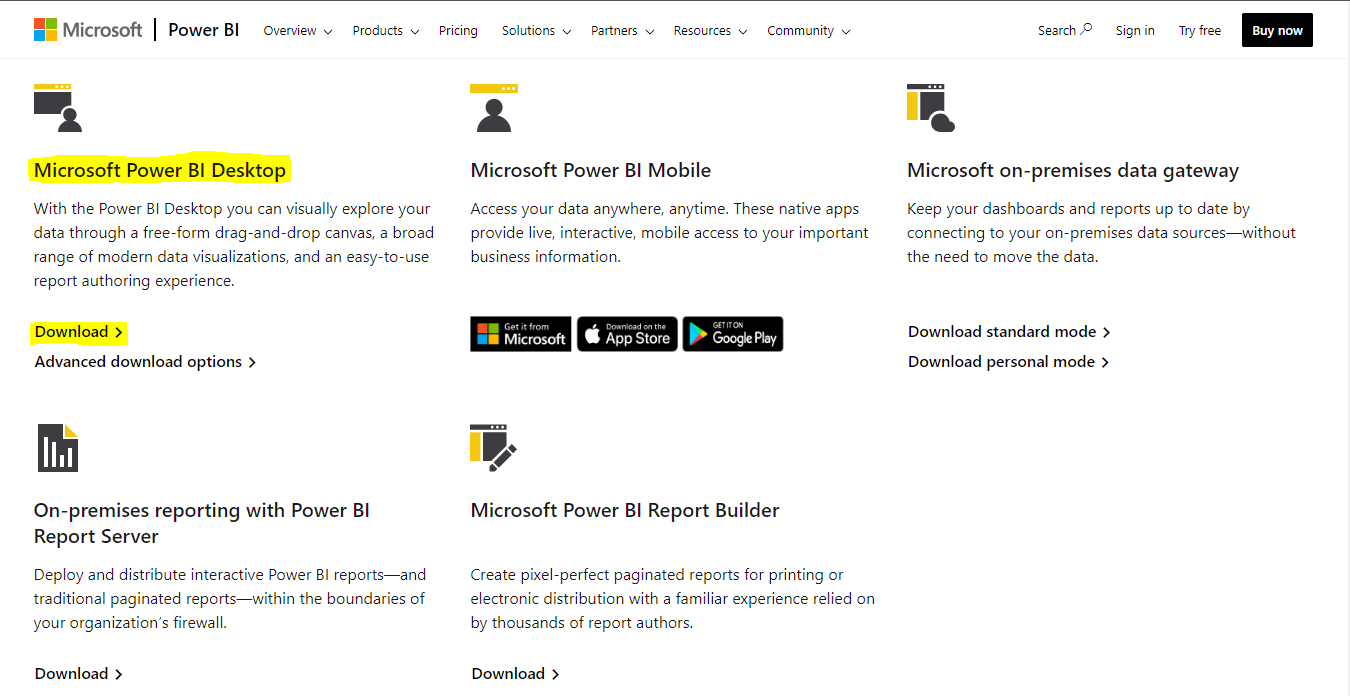
After you download it, run the installer, accepting default settings.
Install Pandas and Matplotlib
Power BI requires two additional libraries to work with datasets and create visualizations in Python. These are Pandas – a data-handling library, and Matplotlib – a data visualization library. To install pandas, open up Command Prompt and enter the following command:
pip3 install pandasNext, install matplotlib by entering the following command in Command Prompt:
pip3 install matplotlib==3.7Enable Python Scripting
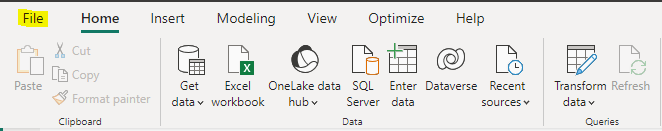
The last step is to verify that Python scripting has been enabled. To do so, select the File Section on the Power BI ribbon.
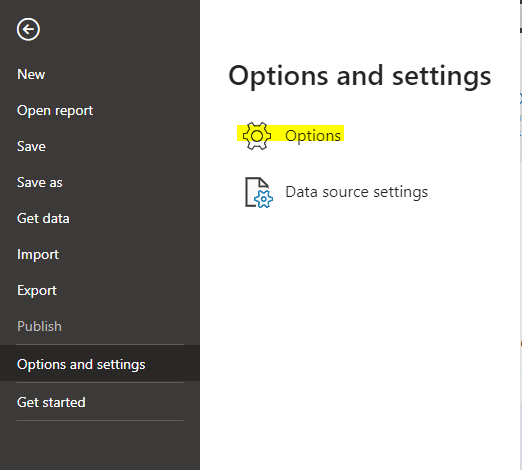
Next, select the Options and Settings option from the menu.
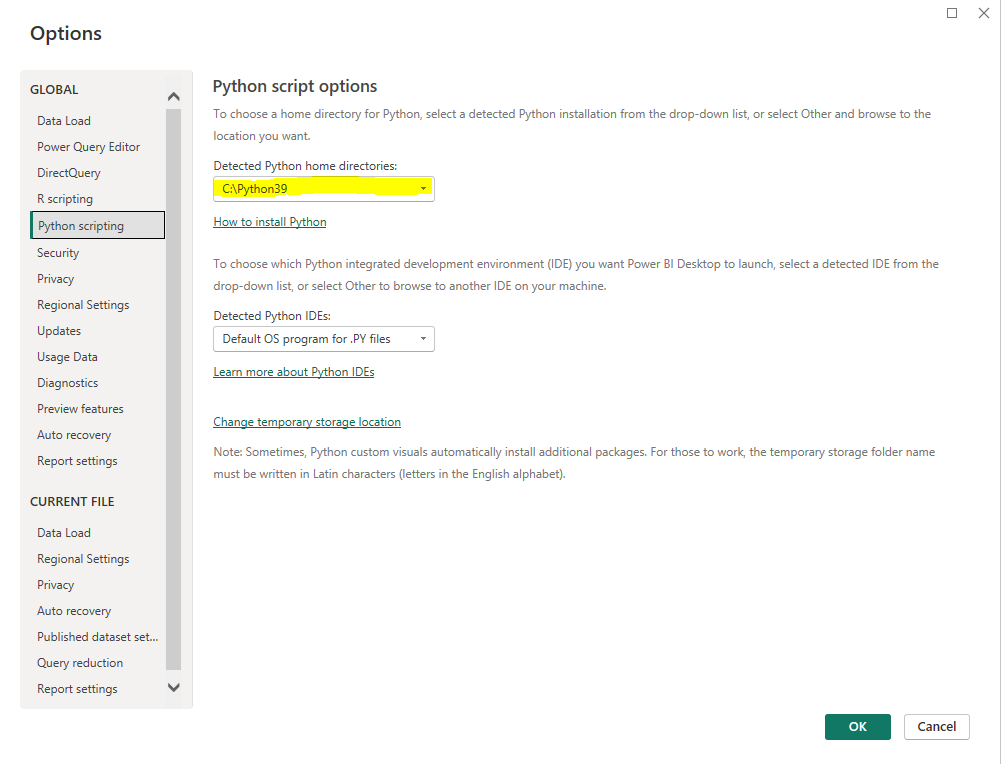
In the Options menu, go to the Python Scripting section and verify that your Python installation folder is listed as the Python folder.
And that’s it; you have Python integrated into Power BI. Next, we will explore how to use it.
How to Use Python in Power BI
To Import Data
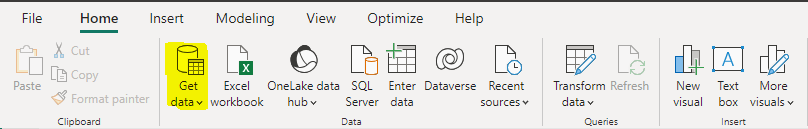
To import data, first, select the Get Data option from the ribbon.
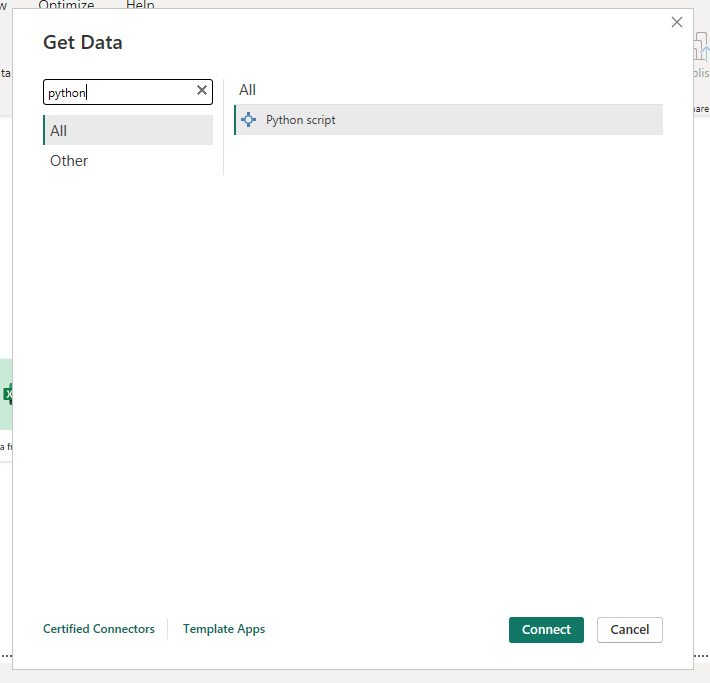
In the popup menu that appears, search for Python and select the Python scripting option.
Enter the following Python code that creates a small dataset into the script input that appears.
import pandas as pd

sales = pd.DataFrame({
    'month': ['January', 'February', 'March'],
    'value': [124000, 240000, 180000]
})
Next, we are going to create a visualization using Python in Power BI.
To Create Visualizations
We are going to create a simple line plot that shows the sales over the three months represented in the dataset we have just created.
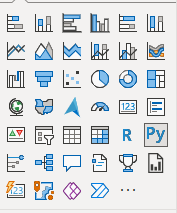
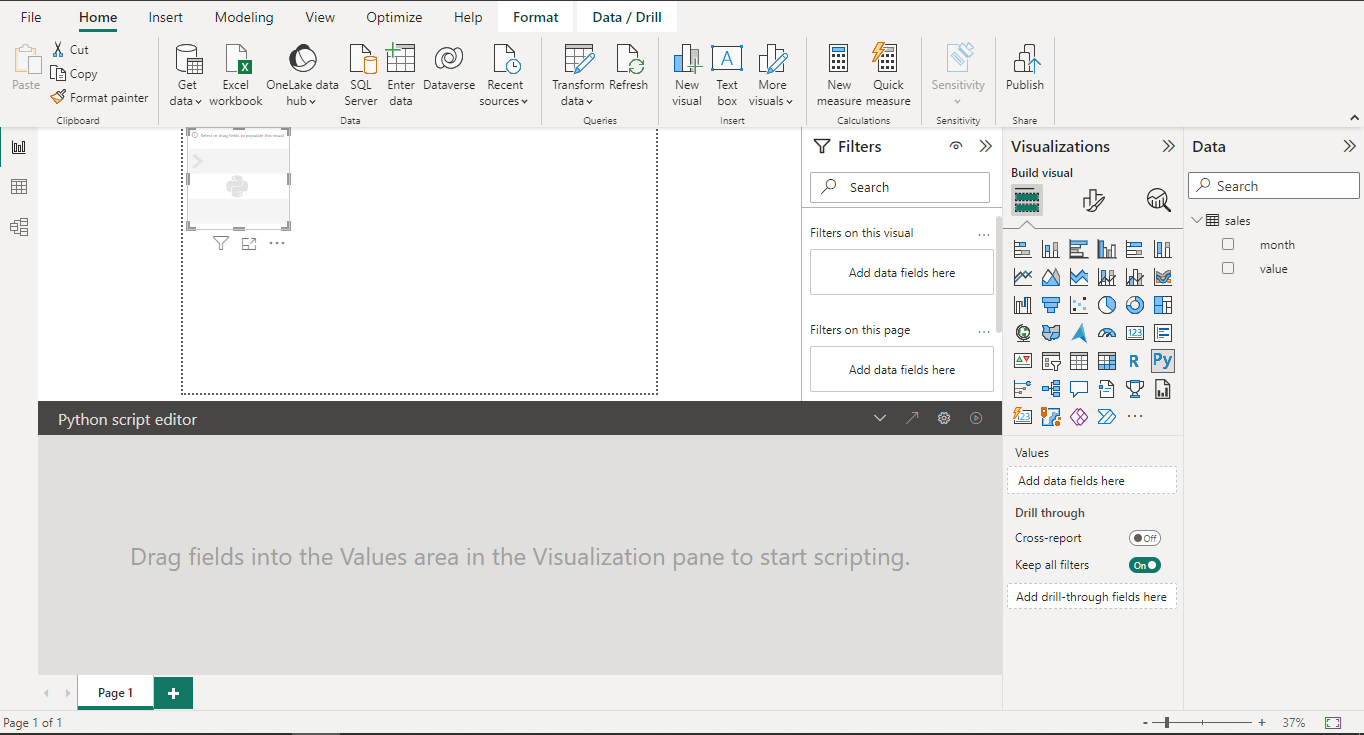
To create a visualization, first, select the Python option from the Visualisations panel on the right of Power BI. The Python option is simply labeled Py. If it does not immediately appear, click on the three dots to find it there.
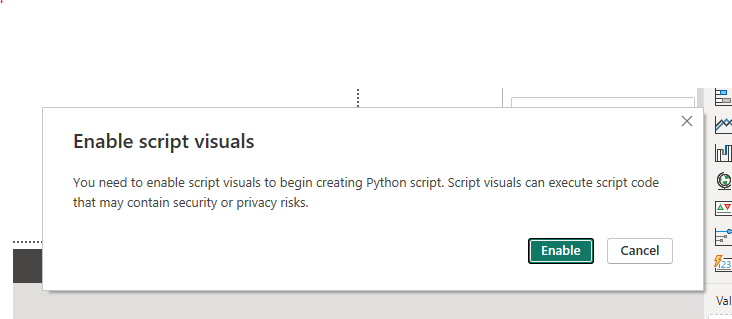
After clicking it, you should get a prompt asking if you want to enable script visualizations. To which you will accept so you can write a Python visualization.
After that, drag the month and value fields from the Data panel on the far right to the Visualisations panel, that is, to the Data panel’s immediate left. Doing this will give you access to the data you use when creating the visualization.
Next, you should see a script editor section that looks like this at the bottom:
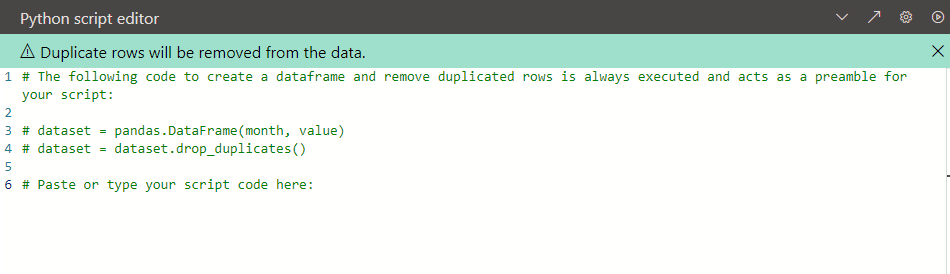
In this script, we have access to the dataset object – which is a pandas Dataframe containing the columns month and value. The script also automatically drops duplicate values. The commented code is always executed even when commented, so we do not have to do anything to it.
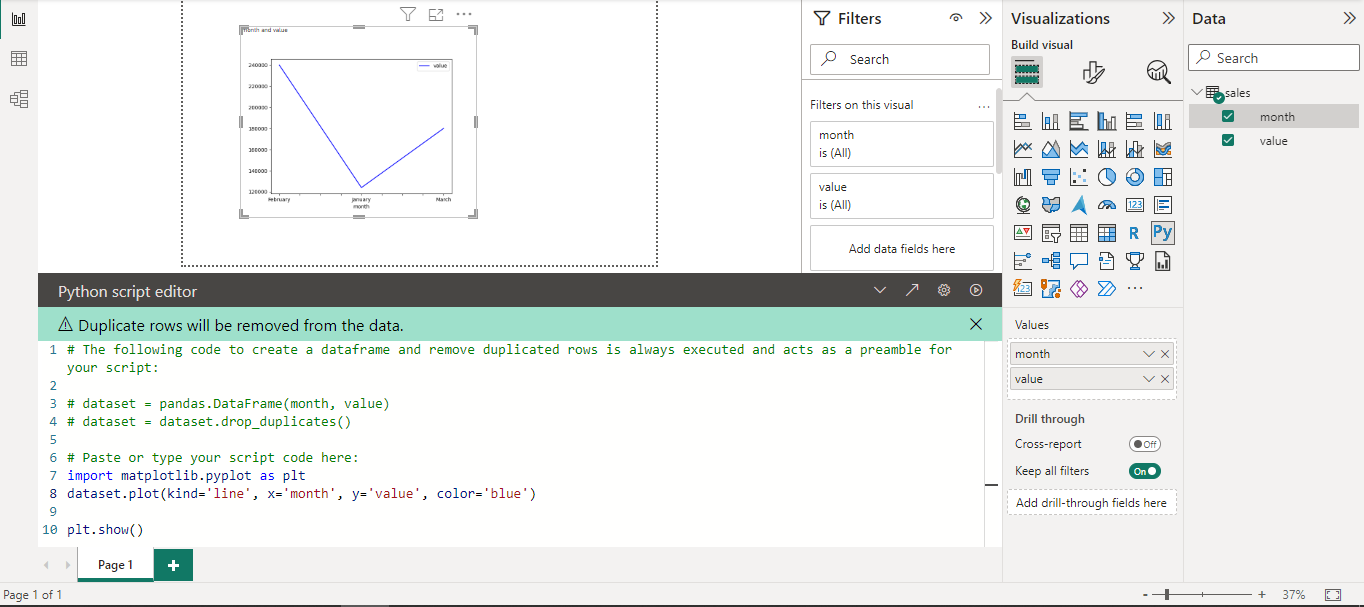
To create our visualization using matplotlib, we write the following code:
import matplotlib.pyplot as plt
dataset.plot(kind='line', x='month', y='value', color='blue')

plt.show()
This creates a line plot from the dataset. The x-axis will contain months, while the y-axis will contain values. The color of the line will be blue.
Next, click the run button on the top right of the script editor, and you should see a visualization appear on your screen.
That’s it! We were able to create a visualization in Power BI using Python. This example can be extended to different visualizations using the Matplotlib documentation.
Sharing and Reusing Code
One of the advantages of using Python to create visualizations is that the code used to create visualizations or import data can be shared across projects. This enables you to quickly generate new reports by reusing code from previous reports.
While there isn’t a built-in mechanism for sharing data in Power BI that I know of, the good old copy-paste should work here. It is a little tedious but better than creating visualizations from scratch using built-in visualization tools.
Limitations of the Python Integration in Power BI
While integrating Power BI with Python carries some advantages, there are some limitations you should be mindful of. These include:
- Python Integration requires particular versions of Python, pandas, and matplotlib. If different versions are used, this could cause errors. It is, therefore, important to ensure proper dependency management to prevent errors.
- Not all Python libraries are supported, which means there are limited Python libraries you can use when writing your scripts in Power BI.
- Risk of running scripts from bad actors. One should be careful about the scripts they obtain online and use in a report. These could be harmful.
Use Cases
Power BI with Python is useful for performing a number of things. These include:
- Creating Machine Learning Analytics applications
- Creating visualizations and real-time dashboards
- Transforming data in more complicated ways
Final Words
In this article, we explored how we might enhance the functionality of Power BI, a popular business intelligence tool with Python – a popular programming language used for data analytics, among other uses. We also covered the benefits and limitations of this implementation. We also covered popular use cases of this implementation.
Next, check out an introduction to Matplotlib in Python.