
Lucidchart is an excellent tool for creating diagrams for data visualization, planning, and making better business decisions.
In this competitive world, it has become essential to stand out in the crowd, whether you are an individual or a business.
So, if you want to understand how your business is doing along with your projects, processes, and people, you can create diagrams and flowcharts and map out your ideas.
The reason is visuals are more effective and understandable than just plain words.
Enter Lucidchart – a powerful tool to help you create effective diagrams. The platform is not only rich with amazing features but also easy to use and secure.
In this article, for you to figure out if it delivers what it promises.
Let’s start!
Lucidchart: An Overview
Lucidchart is an intelligent diagramming solution that you can use to create amazing diagrams, sketches, professional flowcharts, and other designs. It will help you bring together your team, visualize data, and collaborate with them effectively.
The application helps teams of varying sizes from different domains like IT, engineering, education, sales, and more. Whether you are an individual designer or a team, no matter how big or small, you can leverage Lucidchart to create designs. It’s helpful in brainstorming, project management, product creation, and more.
Lucidchart comes with interesting features and capabilities to help you every step of the way. It will help convert your ideas into reality while staying focussed on your goals, making better decisions, and building a sustainable future.
The users of Lucidchart are many, from 99% of Fortune 500 companies to startups. Some of the major users include Google, Amazon, NASA, HP, Atlassian, NBC, and Okta.
Features of Lucidchart
The all-in-one platform of Lucidchart offers these powerful features:
#1. Enhanced Diagramming
Improve your teamwork by leveraging efficient diagramming with in-editor chat, real-time co-authoring, collaborative cursors, and shape-specific comments. Some additional editing and design features include:
- Drag and drop: Drag and drop elements to create your designs easily.
- Smart lining: To make connections between different shapes efficiently and keep them properly aligned, use smart lines.
#2. Style Shapes with Ease
You might have thought of some colors and fonts for your designs. So, instead of going back and updating each shape individually, which would decrease productivity, you can choose the line style and font number, size, and color from “Properties” that you can find at the editor’s top.
Do this before dragging and dropping any shape on the canvas. This will automatically apply the styling to each shape. In addition, you can change a template’s formatting or font by choosing “Select” and then “All Shapes”. You can now style your diagram as you like it.
For drawing a smart line, pull it a little past the edge so it gets the halo effect in blue. Now, release the mouse and see a smart line created between two shapes.
#3. Keyboard Shortcuts
Use some keyboard shortcuts to make your work faster. View them by clicking on F1 or choosing “Help” and then “Hotkey Reference” in the editor. Some of the shortcuts are:
- Make precise shape adjustments by selecting your desired shape and then holding down “Shift”. Now, utilize the arrow key to move shapes gently and get the shape you want.
- Zoom in or out of the diagram you are working on by holding down your space bar and then scrolling up/down using the mouse. It’s a great feature when working with larger diagrams.
#4. Enlarged Canvas
Lucidchart lets you make bigger diagrams with one click. For this, you just need to choose the full-screen button located in the screen’s top right corner. You will see that all the panels will disappear in the editor, and only the enlarged canvas will remain for you to create your designs.
If you want to access a feature, Toolbox, or the Properties bar, just hover over the place where it normally appears in order to activate it.
#5. Containers
Diagrams involve many steps, elements, ideas, and people, which is why they can get complex. Therefore, it’s important to organize them and make them easy to read.
This is where swimlanes or containers are used. A container is a smart shape, and each container signifies a different individual and their respective responsibilities. You can easily place the shapes in a suitable swimlane instead of using too many colors for indicating people and steps.
#6. Shape Actions
You can add additional details to your diagrams, but it shouldn’t make your diagram look overwhelmed with text. With shape actions, you can provide needed information in your diagrams while keeping them clean and quick to read.
For this, choose a shape and click on the lightning icon from “Properties”. Now, choose an action you want to add to your shape, such as toggle, hide or show layers, link to a different page, site, email, etc.
The data linking feature also lets you add more layers to your visuals. You can import data sets from CSV files, Excel spreadsheets, Google Sheets, etc., to create data-driven and powerful visualizations.
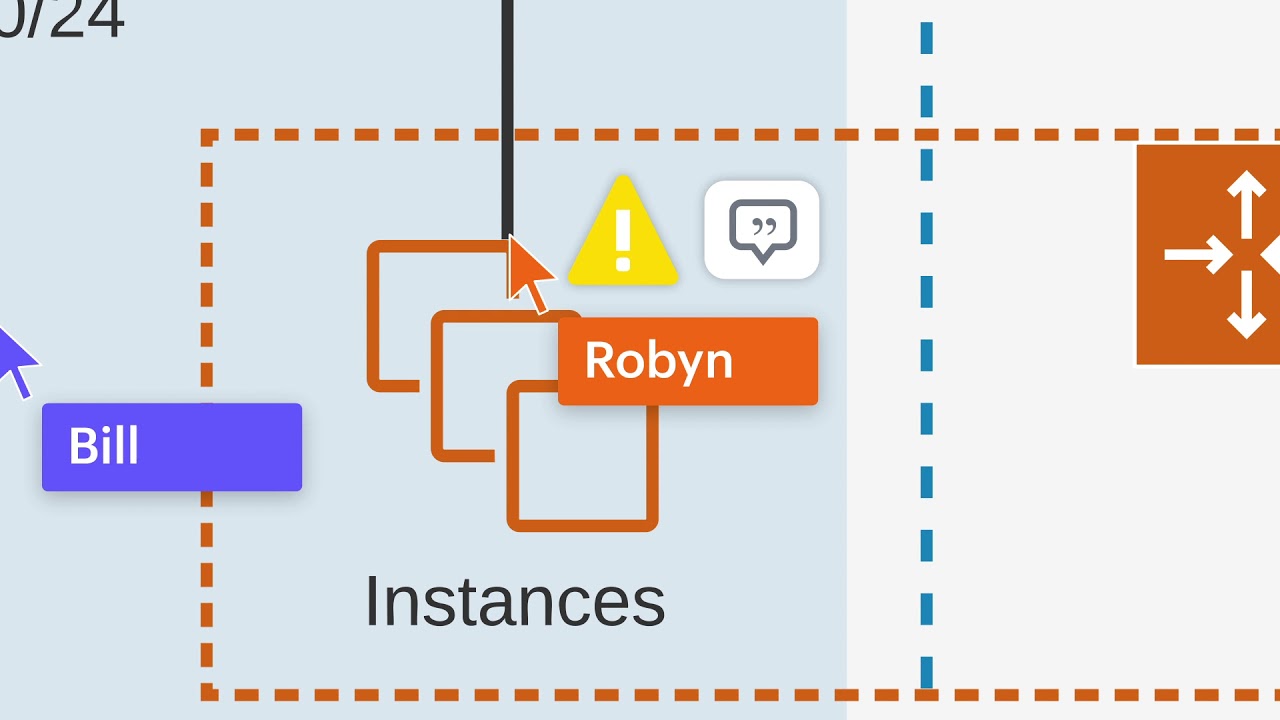
#6. Collaboration
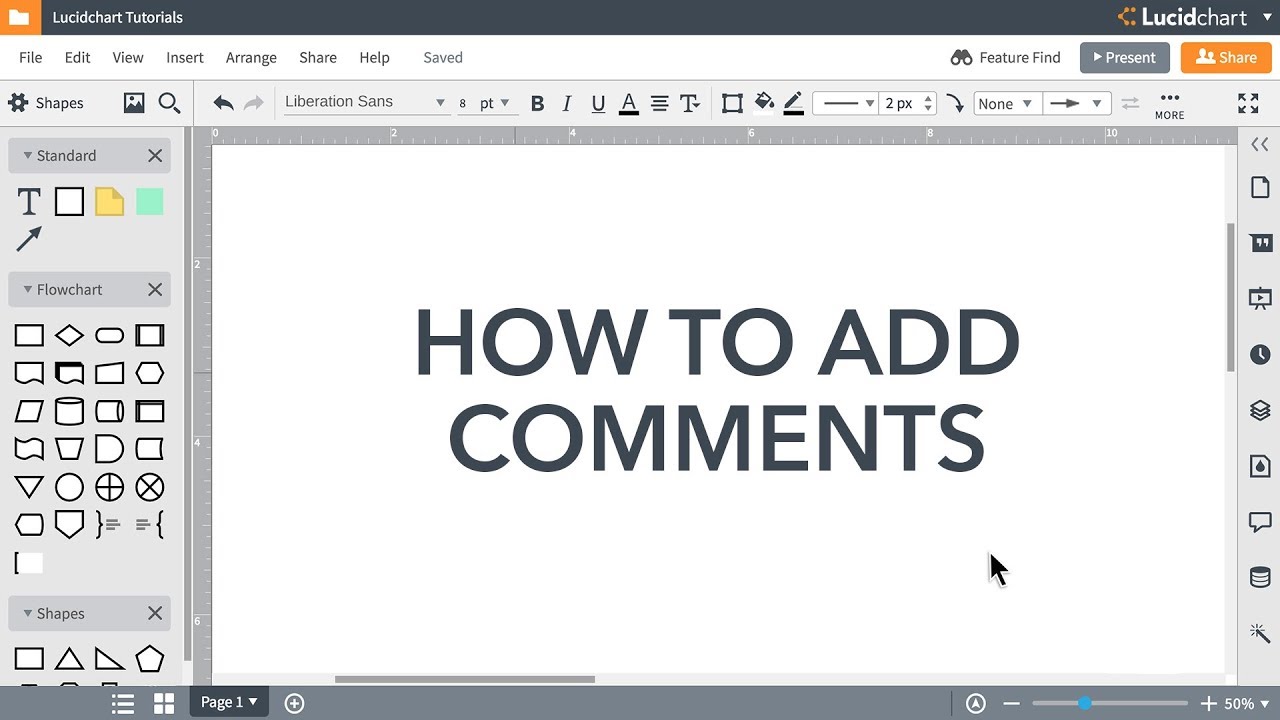
You may seek feedback from your team or superiors for improvements on your diagrams. This will require you to communicate with them and represent the diagrams before them. All this is possible inside Lucidchart without having to jump to your email and kill time by switching applications and reading long threads.
Lucidchart offers a commenting feature where people can leave their comments on a diagram, shape, or document. For this, just select the option “Comment” from the Dock and then click on the “+” sign. It can also be done using the @mention that can alert people for whom it’s given. In addition, there’s a chat option to facilitate communication.
Furthermore, you can use the notes feature if you want to permanently attach your feedback or thoughts to a given shape. For this, right-click on the shape, select “Add Note”, and then write the thought. A note will be highlighted with a grey icon.
#7. Presentation Mode
Presentation is an important element in designing. After receiving feedback from your team and finalizing the diagram, the next stage is to present it in order to serve the purpose for which it’s been designed.

Lucidchart has a presentation mode that you can use to break the diagram into multiple polished slides and present them one by one instead of presenting everything at once. The presentation mode will help you create a story around your diagram and give you better control.
To enable it, find the slides icon at the right-hand Dock and click on it followed by “+Slide”. You will see a yellow box on the canvas, and everything included in this box will be added to the slide. Now, click on “Present” to see the presentation.
#8. Publish
Let the world see your diagram by publishing it publicly. To do this, click on the button “Share” and then on “Publish”.
It’s also possible to generate a link for “view-only” by choosing the full document URL. It will allow anyone to view the document if they have the link but not edit it. And if you want someone to edit it, give appropriate permissions to them.
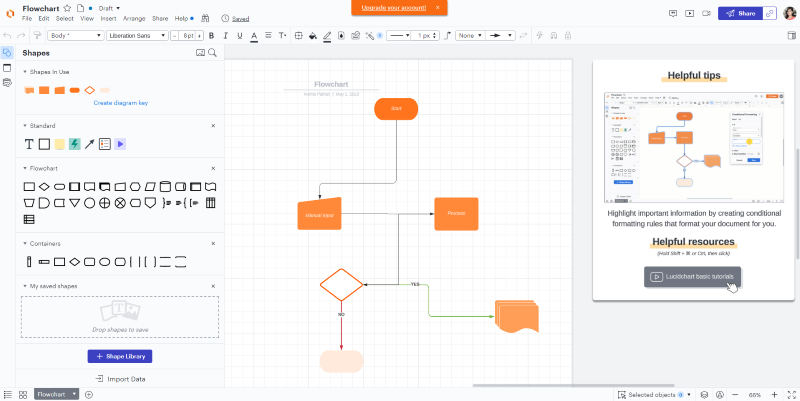
#9. Flowcharts
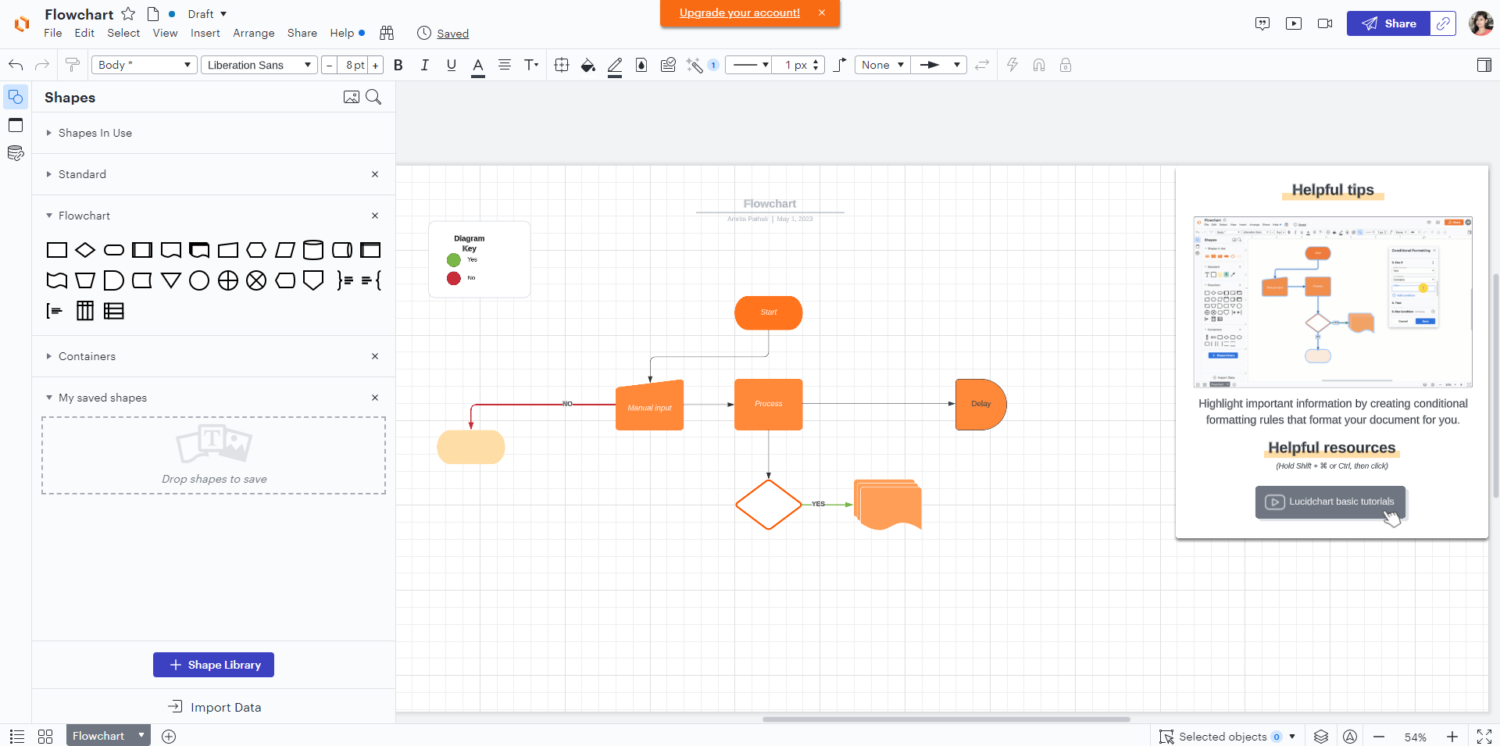
Flowcharts are effective ways to present an idea or plan and provide better clarity. Lucidchart lets you create project management flowcharts, which could reduce text requirements by a great number.
You can draw any type of diagram and process with Lucidchart, reflecting your structured processes and big ideas. This will provide you with alignment and clarity for your teams and members about the project and help you make better decisions in different areas.
#10. Account or Organization Map
Scrolling through unending rows with text-based contacts in your Salesforce account will give you a hard time figuring out the roles and people in your company. In this case, you can connect the Salesforce account with your Lucidchart account and create virtual account maps or plans seamlessly. As a result, you can easily:
- Develop a map for your account by dragging the contacts from your Salesforce account and dropping them onto Lucidchart.
- Visualize key decision makers and other people and processes associated.
- Keep your account up-to-date and synchronized.
#11. Templates
Lucidchart offers hundreds of templates for you to take inspiration from and choose for your projects. These templates will help you get started quickly without investing time in creating everything from scratch. Lucidchart offers templates for:
- Family tree chart
- New user onboarding
- Web app hosting
- Pyramid chart
- Kinship diagram
- Instagram wireframe
- Product training diagram
- Stakeholder maps
#12. Lucidscale
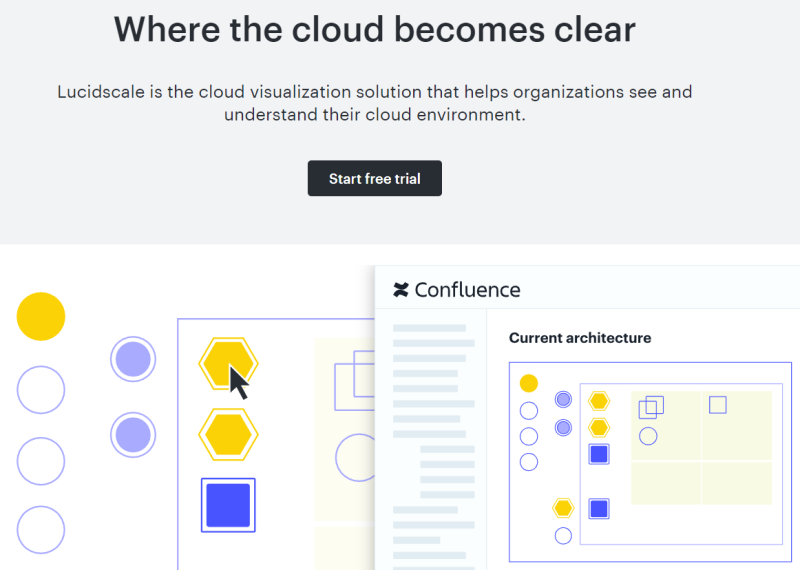
Utilize the cloud visualization tool – Lucidscale to view and comprehend your own cloud environment. This will allow you to view your important cloud governance information in context and inspect whether the elements are unidentified or orphaned. It could lead to reduced costs and risks.
Besides, you can filter models and examine certain elements such as databases, gateways, and instances in your cloud environment.
#13. Integration
Businesses use different types of tools and technologies in their tech stack depending on their needs. This is why Lucidchart has partnered with many companies and software platforms. This will allow users to integrate it with many software solutions and use them without switching tabs. Some of the highly useful integrations by Lucidchart include:
- Amazon Web Services (AWS)
- Zapier
- Slack
- Salesforce
- Quip
- LinkedIn Sales Navigator
- Atlassian
- Jive
- BambooHR
- GitHub
#14. Security

Online threats are increasing every day, harming organizations and users in terms of money, data, and reputation. This is why it’s necessary to use secure systems and software if you are on the web.
With Lucidchart, you don’t have to worry much since it’s dedicated to securing your data and keeping threats at bay. It recognizes that customer data is a highly valued asset that needs protecting. It provides industry-grade security technologies, methods, practices, and policies.
Lucidchart uses a 256-bit encrypted network connection through TLS 1.2 to protect data transferred between Lucid servers and user devices. In addition, it uses AES-256 encryption to safeguard your data’s secrecy. Lucid also uses cryptographic keys by the Key Management Services of Amazon.
Lucidchart is certified to:
- SOC 2 Type II
- FedRAMP In-Process
- PCI
- EU-US and Swiss Privacy Shield
- ISO 27001
#15. Privacy
Lucidchart doesn’t claim your data’s ownership and respects your privacy, promising never to share your data publicly without your consent. You can retain your rights (like intellectual property rights) over your data and files.

Lucidchart complies with GDPR and CCPA and uses a permitted framework (like Standard Contractual Clauses) to transfer customers’ data to the US from the UK, Switzerland, and EEA. In addition, the sub-processes of Lucid use Binding Corporate Rules or SCCs to perform data transfers. Also, Lucid is certified by the EU-US Privacy Shield.
Lucidchart Use Cases
Lucidchart gives you everything to visualize your complex ideas with more clarity, speed, and collaboration, no matter what your objective if using this platform is. Here are some of the use cases of Lucidchart:
Creating Business Process Maps
You can create business process maps easily by using the intuitive drag-and-drop feature of Lucidchart. It will help you spot inefficiencies where you can improve and make your processes efficient again. In addition, it’s pretty easy to update the maps with the change in your business processes since Lucidchart is flexible and adaptive.
Aligning with User Flows

Using the flowchart creator by Lucidchart, you can create flowcharts to present the current and future states of your business and where users stand. It will give you different perspectives on user flows and what changes would be best for them.
Thus, you can make better decisions for users by comparing the two flowcharts. Once the best path is finalized, proceed and align your goals with the path to benefit users and, ultimately, your business.
Planning and Organizing Scrum Teams
Plan and organize your scrum teams and members by their location, skill sets, key competencies, etc. This makes it easier for you to assign people to the best areas where they can perform to the best of their potential. It also helps you align the teams with your current business strategies.
Mapping Data Flows
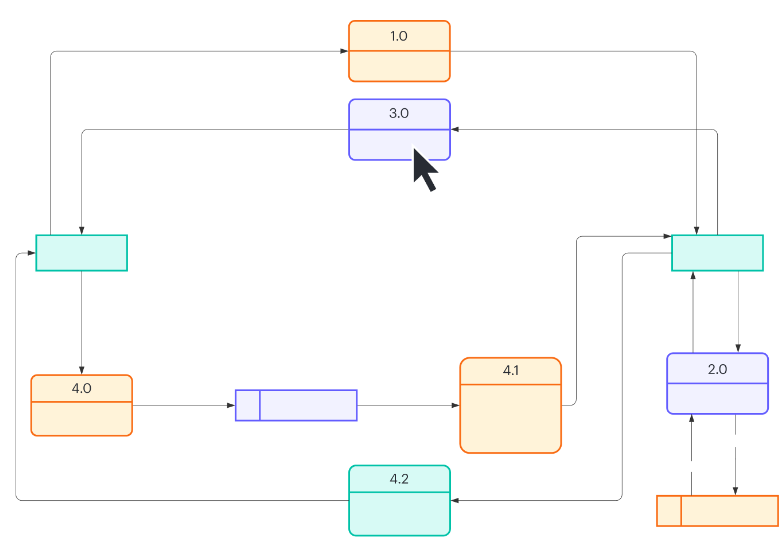
Create maps and visualize how your data flows and transforms for different business processes. Thus, you can visualize the origin of data clearly, how it’s stored, and the location it travels to. In addition, you can add live information to the diagrams and get a precise understanding of your processes and systems.
Pricing
Lucidchart has something for everyone, whether you are an individual or have a startup, small business, or enterprise. Its pricing plans are as follows:
#1. Free
This plan won’t cost you anything. You can get started for free without your credit card. It includes these features:
- 100 templates
- 60 shapes for each Lucidchart document
- 3 editable Lucidchart documents
This plan is best for individuals with fewer needs.
#2. Individual
The Individual plan will cost you $7.95. The features included in it are everything from the Free plan plus:
- Unlimited elements per document
- Unlimited editable Lucidchart documents
- Presentation mode
- Premium templates and shape libraries
- 1GB storage capacity
This plan is suitable for individuals with growing needs or startups and small businesses looking for affordable plans and decent feature sets.
#3. Team
The plan costs $9 per user and includes all the features from the Individual plan plus:
- Revision history and versioning
- Password-protected publishing
- Integration with Microsoft 365, LeanIX, Jira, GitHub, and Confluence
It’s best for growing businesses.
#4. Enterprise
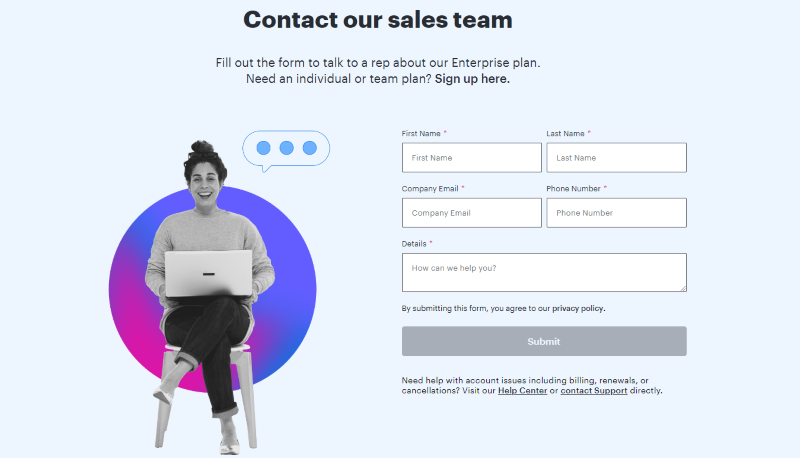
Contact sales to get the quote based on your requirements. The plan has all the features from the Team plan plus:
- Virtual whiteboarding with Lucidspark
- Customizable document status
- SAML authentication
- Advanced automation
- Salesforce integration
Conclusion: Is Lucidchart Worth It?
In a word, yes!
Lucidchart has an impeccable set of features that will allow you to create professional diagrams with ease. It has a huge library of templates, shapes, and elements to help you present your ideas, visualize data, and make better decisions.
Using Lucidchart is easier for both beginners and experienced users alike, and its pricing plans are suitable for individuals and different businesses.
So, go ahead and try Lucidchart to feel its power yourself.
You may also explore some best software to create beautiful Gantt charts for your projects