
Monitor, analyze, and visualize all-important business data from Google Analytics, AWS, Twitter, Github, etc., in a single dashboard.
Considering the increase in the number of tools we have for social media, analytics, etc., it would be time-consuming to log into an individual tool’s dashboards to monitor and visualize the important data.
If you are spending a lot of time in various admin panels/dashboards, you need some centralized tool to visualize everything on one dashboard.
Are you in need of something like this?
If you are, then the following tools will help you.
DashThis
Listed as Canada’s Fastest-Growing Company in 2020, DashThis is an all-in-one solution to visualize your marketing data under a single platform. It is an automated reporting tool built to assist marketers in saving time and creating reports quickly.
You can even customize this reporting solution to fit your business requirements. So whether you are a marketing agency, franchise, small business, or freelancer, DashThis can support you. Not to mention, thousands of digital marketers and agencies from 122+ countries have benefited from this tool to create swift marketing reports easily.

It comes with a simple and straightforward analytics dashboard that anyone can use instead of doing everything manually. Scaling your business by utilizing powerful and stunning reports is now easy with plenty of valuable features. They offer more than 34 connected integration data managers, and your data and KPIs will be available all the time at your fingertips.
You can use their built-in marketing templates instead of creating a new dashboard report every time from scratch. Simply select your preferred template, choose a time period for the report (monthly, quarterly, etc.), connect your data, and start visualizing. Furthermore, you can use their cloning and grouping features to make things even simpler.
DashThis also offers bulk dashboard creation and editing services if you have hundreds of dashboards to edit and import a vast amount of data. Besides, you can share your dashboards easily by adding your colleagues and giving them access to create and edit dashboards. You can also automate report distribution using automatic email dispatches, allowing real-time access to your clients.
Organize your data the way you want and display them with customizable widgets, section headers, comment boxes, and present themes. DashThis can integrate seamlessly with Google Analytics, AdWords, and Search Console; Facebook Insights and Ads; Twitter, LinkedIn Page, Instagram Ads, Yahoo, YouTube, Bing Ads, Moz, SEMrush, Ahrefs, etc.
The platform offers a white label feature so you can change or customize your dashboard URL with tailor-made widgets. Also, you can import data using the CSV file importing system.
Improvado
Connect your marketing data to Amazon S3, Google Big Query, Google spreadsheets, Tableau, Google Data Studio, Looker, and more with the help of Improvado. It supports 200+ such connectors to empower your marketing department with zero engineering needs.
These connectors also include popular ones like Facebook Ads, Instagram, HubSpot, LinkedIn, Shopify, Salesforce, MySQL, MariaDB, SQL, Power BI, Excel, Qlik, Domo, and more. You can centralize your entire marketing data in Improvado’s single dashboard and visualize data with your favorite tools.

In addition, use its data transformation system to perform complex or simple data transformations based on your business demands. With Improvado, you can always access raw data and streamlined reports when you need them. As a result, you can obtain answers faster while uncovering more useful insights.
Improvado empowers you to change the way your business utilizes data by building customized display ad dashboards, Amazon performance dashboards, and YouTube marketing dashboards.
FusionCharts
Build awesome mobile and web dashboards with FusionCharts‘s responsive and interactive charts, consistent API, cross-browser support, and extensive documentation. It helps you get 100+ graphs, gauges, and charts as well as 2000+ choropleth maps.
FusionTime offers stock charts and robust time series without hampering next-gen dashboards. Allow your users to export the entire dashboards in PDF format or send a copy of it via email. Get each variation of charts such as column, pie, area, line, and bar.

Furthermore, you can see domain-specific charts such as Heatmaps, Gantt charts, Gauges, Spider charts, Marimekko charts, Waterfall charts, Treemaps, and many more. The time-series charts help you in visualizing thousands of data for your IoT apps.
In addition, you will get various installation options like CDN, direct JavaScript, and NPM. FusionCharts uses plugins and front-end integration to help developers to complete the projects faster.
FusionCharts have everything you need at a starting price of $499/year.
monday.com
Make your business decisions efficiently with management software that gives you a complete overview of things at a glance. It’s monday.com which comes fully loaded with tools to track progress, budgets, and timelines and create custom dashboards with ease. You can also visualize the reports easily from the high-level overview of each detail.

You can use data tools to make intelligent decisions, assign tasks, prioritize each task, see who is on the task at what time, and share files. The customizable board keeps everyone working on the game goal.
Track progress by using a timeline, charts, calendar, and other views. Get a clear view of your team’s resources to know the capacity of each member and improve the workflow accordingly. Let your team focus on necessary tasks rather than wasting time on manual tasks.
Using the tools of monday.com to manage the whole process is entirely free for up to two seats. If you need more than two seats, you can choose a plan according to your requirement, starting from $10/month/user and taking a 14-day free trial.
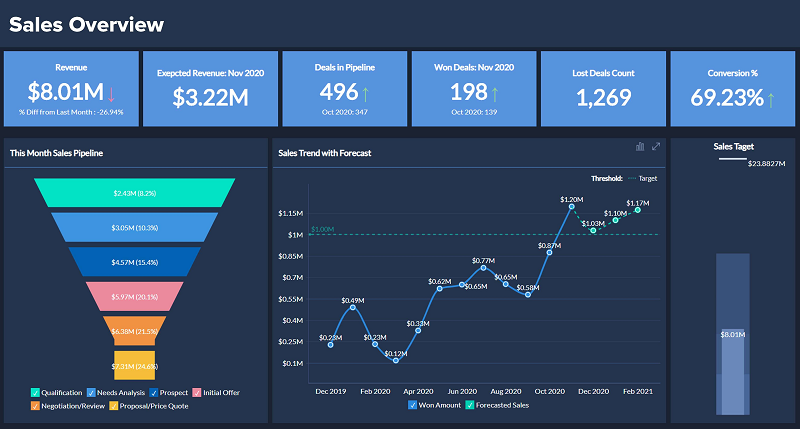
Reportz
View and track all your marketing data under a single reporting system of Reportz that never lets you worry about reporting. Just create a dashboard, share its link with your team, and visualize; that’s it.
You can get started by obtaining KPIs and real-time data from your marketing streams and then customize your dashboards easily. Reportz comes with an intuitive, simple dashboard that supports white labeling.
They have designed it keeping in mind automation, data access with different points in real-time, and integrations with marketing tools. As a result of all these capabilities, you can generate reports within a few minutes, instead of hours, as with traditional manual processes.
You can choose from pre-set date periods (days, weeks, or months) or go for custom dates. They are also going to introduce dashboard templates for different types of reports such as content marketing performance reports, social media activity reports, SEO KPIs reports, link building reports, and more.
Reportz supports integration with tools like Google Analytics, RankRanger, Ahrefs, Google Search Console, SEMrush, Facebook Ads, Google Ads, LinkedIn Ads, Instagram, Salesflare, Google My Business, SERPstat, Google Sheets, SERanking, WooCommerce, Mailchimp, etc.
Moreover, Reportz takes care of your security by letting you safeguard your KPI dashboard with passwords. You can also regenerate URLs for dashboards and then share its link with your clients or trusted colleagues to maintain security.
Cyfe
Cyfe provides the all-in-one dashboard for monitoring and analyzing social media, support, analytics, infrastructure, etc.

There are hundreds of pre-built widgets available for you to use, including:
- Google Analytics, Google+, Google Adwords, Google AdSense, Google Trends, Gmail
- Facebook, Facebook Ads, LinkedIn, Pinterest, Twitter, Instagram
- WordPress, Shopify, Eventbrite, Fresh Books
You can download the data in PNG, JPEG, PDF, or CSV formats. You can get it started for FREE, so go ahead and try yourself to see if Cyfe satisfies your requirement.
Geckoboard
Geckoboard is one of the most popular live TV and KPI dashboard software to visualize almost anything including the following.

Giant online businesses use Geckoboard like Airbnb, Slack, Skyscanner, Netflix, HootSuite, etc.
Freeboard
Freeboard helps you visualize the Internet of Things data in the impressive dashboard. It’s open-source, and you can get it started for FREE for unlimited data, widgets, and dashboards.
You can integrate your data with Freeboard with dweet.io or any kind of web-based API.
Check out some of the dashboards created using Fireboard.
Air quality – https://freeboard.io/board/538e1374f1776c1c2e000713
Humidor – https://freeboard.io/board/538e1392f1776c1c2e000714
Databox
Keep all your business KPIs in one place at Databox. Databox is a mobile-first dashboard solution for marketers, executives, and analysts.

As you can see above, you can connect your favorite data source to analyze and create a meaningful dashboard.
Databox offers a free plan where you can create 3 data sources and data refreshed daily.
In just a few minutes, I created the above beautiful dashboard from my Google Analytics data.

App Insights
Keep all your metrics in one place with AppInsights. AppInsights provide solutions for marketing, DevOps, analytics, project management, customer support, etc.
You can have your business data shipped from various sources, including the following.
- GitHub
- Adobe/Google Analytics
- HubSpot
- Mailchimp
- Pingdom
- Zendesk
Creation of a dashboard is easy; you can hands-on with their free trial plan.
Tableau
Tableau is one of the popular data visualization solution providers available on a desktop, server, and in the cloud. Tableau cloud is a self-service in the cloud where you pull the data from anywhere and invite your team to see the actionable report.

You can also embed the interactive data within another app like salesforce.
Zoho
Zoho is one of the easiest platforms to create online dashboards, which provides insightful business metrics. This business dashboard is used by 14 thousand of customers supporting 2 million users.
It is trusted by the world’s top brands, including IKEA, Canon, COMCAST, Citrix, Dell, HP, and many more.
Its granular and in-depth metrics, such as charts, widgets pivots, etc., help to create insightful key performance indicators (KPIs) reports and dashboards.
Its dashboard is versatile with a drag-and-drop interface, easy tracking of KPIs, and easy-to-share reports with teammates or seniors for further analysis.
In-depth reporting for precise data insights, and it is quite easy to schedule the report that it sends automatically.
To have deeper analytics, Zoho provides a formula engine to build new calculations to derive mathematical and statistical functions. Its versatility makes accessing it easily across various devices such as PCs, laptops, tablets, and mobile phones.
This feature-rich business dashboard is used across diversified sectors for Sales, Financial, Project Management, Marketing, Helpdesk & Support Dashboards.
klipfolio
Klipfolio is one of the top-rated cloud-based web apps that help grow your business by understanding the data, visualizing the metrics, and tracking the KPIs (Key Performance Indicators).

It helps to discover, visualize, display, and share your data in real time. You can also compare the progress of your business with comparing with your historical data.
Klipfolio has two major products – Klips and PowerMetrics. Klips helps businesses to create and share insightful dashboards and reports across the company and stakeholders. PowerMetrics, as the name suggests, is a comprehensive tool for converting raw data into metrics to provide timely and meaningful business insights for growth, competitive advantage, and better business decisions.
One of the biggest advantages is creating a customized dashboard based on varied client requirements by utilizing unique themes with CSS features and Javascript files.
To create dashboards and derive meaningful insights, Klipfolio can access data from various sources such as on-premise storage, cloud applications, spreadsheets, SQL DBs, etc.
Its multifunctionality platform enhances its usage across diversified verticals such as SaaS, Data Analysts, Accounting/Finance, Customer Support, Digital Advertising, Social Media, Operations and Product Management, and many more.
Last but not least, it allows hundreds of integrations, so if you are using any applications from Marketing to Finance, you can pull your company’s data using its handy web-accessible resource connector, which will help you to access the data in real-time to make business decisions.
Currently, the software is used by over 11,000 customers for various purposes, such as online web dashboards, Email dashboards, TV Dashboards, Mobile Business dashboards, PDF Dashboard Reports, and KPI dashboards.
I hope the above solutions help you to create an actionable dashboard and report for your business.