Sales is an integral part of every business – irrespective of the industry size.
However, at times, sales managers are overwhelmed by lengthy sales processes and hidden data lying around, with no potential insights that can be extracted from them.
But the above statement holds true only until you bring a sales dashboard into the game.
A sales dashboard allows you to track, monitor, and analyze your sales data from multiple platforms under one roof and in a highly-visualized manner.
To further ease the process, we have several sales dashboarding tools that come into play.
In this article, we’ll show you how to create a sales dashboard from scratch, discuss some important sales metrics, and then explore the top sales dashboard tools to help your sales team increase productivity and efficiency.

How to Create a Sales Dashboard
When creating a sales dashboard, every step has a certain amount of dependency on another. So, ensure that shortcuts aren’t part of your creation process.
That said, here’s a simple step-by-step guide on how to create a sales dashboard from scratch.
Step #1. Define Your Financial Goals
Think about it – At the end of a quarter, where do you see your revenues? There’s certainly a number in your head.
So get on a call with your BODs (Board of Directors) and agree on a mutual goal. Most importantly, don’t rely on assumptions and intuitions when defining financial goals.
Ensure that the end goal (which everyone agrees upon) covers your R&D and operational expenses and still leaves money on the table for business expansion.
Step #2. Determine Which Sales Metric Align With Your Goals
Next, start by identifying the sales metrics you want to track. Ask yourself some key questions, like:
- What metrics do you regularly review among your sales team?
- Are some metrics more important than others?
- What KPIs do you use to gauge the sales team’s performance?
- Do you have one or multiple sales teams in your organization?
A collective answer to all these questions will help you narrow your hunt for metrics and stay put on what’s meaningful.
Step #3. Identify the Use Cases of the Dashboard
There’s no one-size-fits-all sales dashboard, so you must double-check if your KPIs align with the use cases.
For example, is the dashboard for individual sales reps to gauge their progress against sales targets? Or will sales managers use it to see the top-performing reps for the quarter?
Here’s a quick questionnaire to come up with the most important use cases of your sales dashboard:
- Who will use the dashboard? Sales reps, managers, or management executives?
- How often will they use it? Daily, weekly, or monthly?
- What information will they want to see?
Step #4. Pick a Sales Dashboard SaaS
Gone are the days when you overworked your fingers to create a simple sales dashboard.
Many SaaS companies are now offering KPI tracking and dashboarding solutions – no code required, stunning visuals, and lightning-fast speed.
But the same goes for dashboard providers – there’s no one-size-fits-all dashboard tool in the market. And so, when cherry-picking a dashboard provider, ensure that the software at the least carries these features:
- A set of pre-built dashboard templates and data-visualization elements
- Integrations with third-party apps and data-sources
- Seamless team onboarding and collaboration
- Easy to create and share reports on the go
But before you make any investment, let’s discuss the benefits of sales dashboards.
Why Do You Need a Sales Dashboard?

#1. Improved Decision-Making
Sales dashboards enable sales teams to access real-time data and insights, allowing them to make informed decisions quickly.
Moreover, with the ability to visualize data in one place, sales reps can identify trends and patterns quickly and make data-driven decisions that can improve their overall performance.
#2. Increased Sales Performance
By providing real-time data and insights, sales dashboards help sales reps stay on top of their performance and track progress toward their targets.
This enables reps to adjust and improve their sales strategies, identify areas of opportunity, and take action to increase their sales performance.
#3. Enhanced Team Collaboration
Sales dashboards tools offer built-in collaboration for teams. Thus, allowing them to work in a synchronized way and enabling collaborative decision-making.
Besides, it also promotes transparency as team members can easily see the progress of their colleagues, identify areas where support is needed, and work together to achieve common goals.
#4. Better Forecasting
Sales dashboards allow sales teams to identify trends and patterns that can be used to make accurate sales forecasts. This enables reps to predict future sales performance and plan accordingly, making it easier to meet or exceed their targets.
#5. Improved Customer Relationship Management
Dashboards give sales teams insights into customer behavior, preferences, and buying patterns.
The insights can also be used to develop more effective sales strategies, tailor messaging to specific customer segments, and improve overall customer experience, ultimately leading to increased customer satisfaction and loyalty.
Sales Metrics You Must Track
Let’s now look at the metrics commonly tracked by most organizations.
Metric #1. Monthly Sales Growth
Monthly Sales Growth is a performance metric that measures the percentage change in sales revenue month-over-month.
Monthly Sales Growth = (Monthly Sales in Current Period – Monthly Sales in Previous Period) / Monthly Sales in Previous Period * 100
Metric #2. Average Sales Cycle Length
The KPI measures the average time from the first interaction with the prospect to closing a deal. Reducing sales cycle length is essential for better transparency and quick sales. Besides, you can use this metric to evaluate the efficiency of your sales process.
Average sales cycle length = Total number of days to close all sales / Total number of new deals
Metric #3. Average Profit Margin
The average profit margin is a financial metric that measures a company’s profitability by calculating the percentage of profit generated by the company in relation to its revenue. It measures how much profit a company makes on each dollar of sales.
Average profit margin = (Total revenue – Total expenses) / Total revenue
Metric #4. Sales Per Rep
Sales Per Rep is a team-specific metric that evaluates how many sales each member of the sales team contributes to the overall sales over a period.
Sales Per Rep = Total Sales / Number of Sales Made by Rep
Metric #5. Customer Lifetime Value [CLV]
The customer lifetime value is a predictive metric that estimates the total revenue a customer will generate over their relationship with the company.
Customer Lifetime Value = Gross margin % * retention rate * average revenue per customer
Metric #6. Customer Acquisition Cost [CAC]
The metric measures the cost incurred in acquiring new customers. It involves the cost of sales and marketing activities directed toward turning leads into customers.
Customer Acquisition Cost = Total cost incurred on sales and marketing / Total Customer Acquired
Metric #7. Percentage of Closed Deals
This is a result-oriented metric that calculates the percentage of potential customers that were converted into actual customers over a given time frame.
Percentage of Closed Deals = (Number of Closed Deals / Number of Sales Proposals) * 100
Now that you know the what and why of Sales KPIs, it’s time to explore platforms you can use to create sales dashboards.
Geckoboard

Geckoboard is a KPI tracking and dashboarding tool that integrates with over 80+ data sources.
Features
- With Geckoboard, you can quickly pull in additional data using spreadsheets, databases, Zapier integrations, and custom API.
- Use built-in data filters to select the exact metrics and range you want and create custom KPI cards.
- Has an intuitive drag-and-drop customizer to easily resize, rearrange, or group all data in your dashboard.
- Easily share your dashboard using smart-link or share snapshots of the dashboard on Slack channels and over email.
- Enable the share-to-TV feature to broadcast live dashboards on office TV screens and uphold transparency and competition among your sales reps.
Geckoboard’s intuitive sales dashboard gives Sales Managers a complete overview of all sales-related metrics to stay on top of things.
Monday.com

Monday.com helps you visualize your sales data via stunning sales dashboards.
Features
- Built-in collaboration tools to assign, prioritize, or share tasks with team members
- Create custom dashboards using pre-built widgets like timelines, calendars, and charts to track progress efficiently.
- Set redundant tasks on autopilot and reserve sales reps for ice-breaking jobs.
- Seamless integrations to popular third-party apps like Shopify, Mailchimp, Gmail, Gsheets, and many more
Monday.com has some global brands under its customer base, like Coca-Cola, Canva, EA Games, Genpact, and more.
SmartSheet
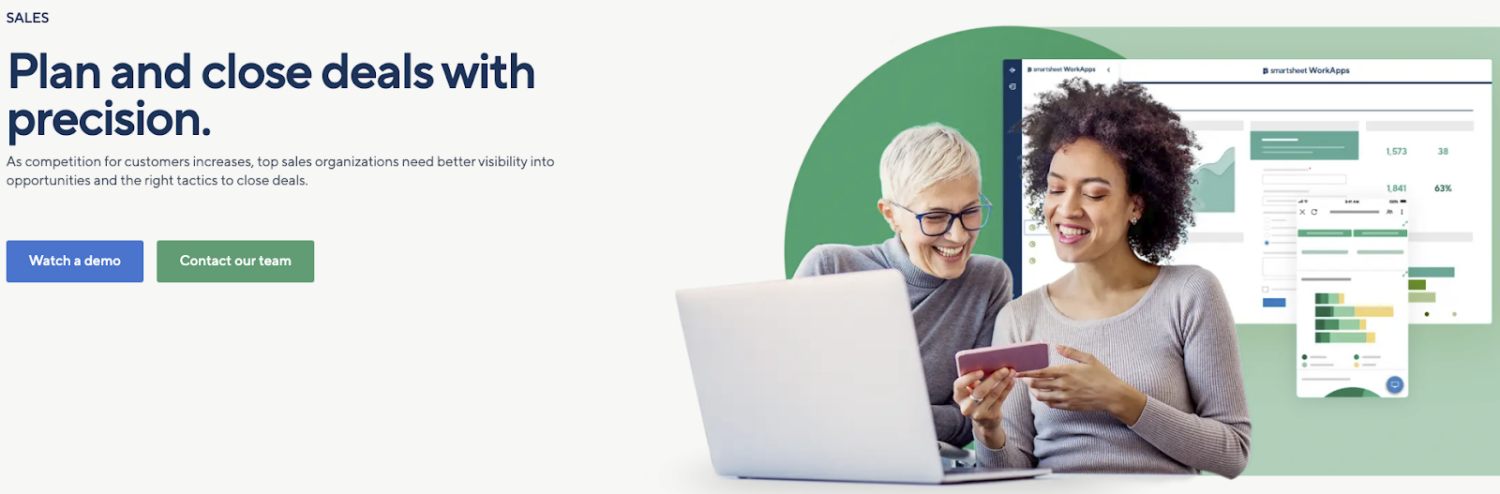
SmartSheet is a collaborative work management platform allowing sales teams to streamline their processes and increase productivity.
Features
- Has an easy-to-use interface allowing sales managers to efficiently synchronize sprints, manage resources, and handle unlimited teams at once
- Perform predictive analysis to get real-time and accurate sales forecasts and determine realistic targets for teams.
- Effortlessly manage complex customer engagement processes, streamline sales processes, and build a more transparent sales pipeline.
- Create a safe customer onboarding system with enterprise-grade management, security, and control.
The platform enables sales teams to manage their leads, track their pipeline, collaborate with team members, and analyze their sales data. It provides customizable templates for lead and opportunity management, as well as advanced reporting and analytics capabilities.
Wrike
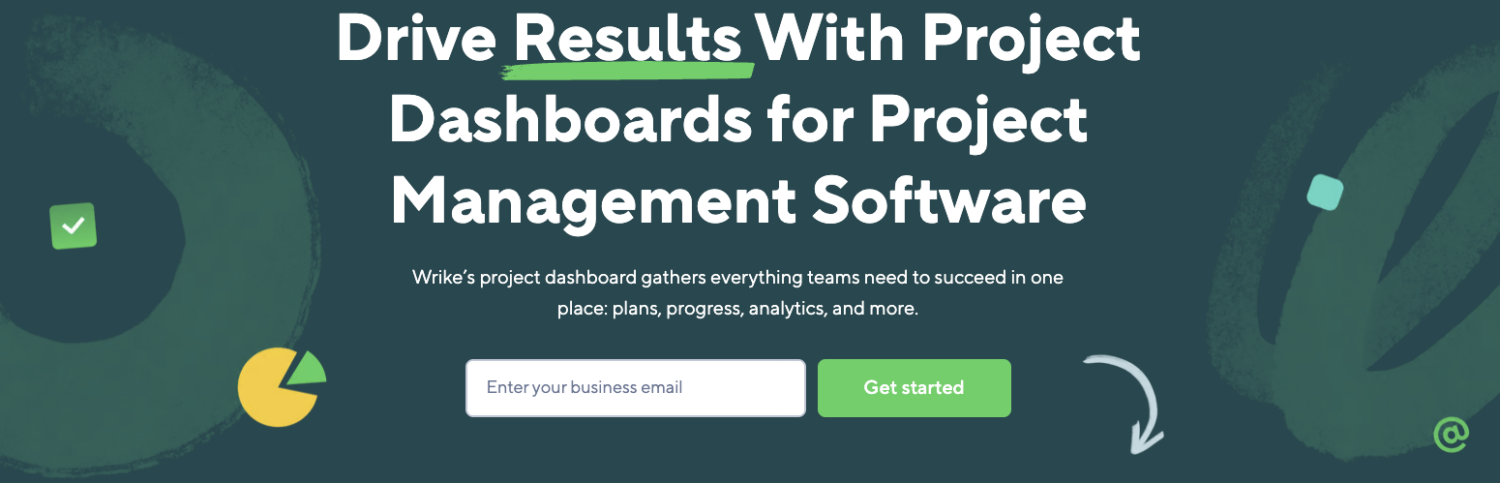
Wrike is an all-in-one work management platform with an effective sales dashboarding solution.
Features
- Has integrations to over 400+ popular apps, plus custom integration options for advanced users
- Built-in widget builder to create custom metrics and visualize data in real-time (really helpful in time-sensitive situations)
- Use Kanban boards to track progress, create timelines, schedule calendar dates, and share updates easily.
- Offers seamless team collaboration on projects, with features like commenting, file sharing, and @mentions
Wrike is trusted by over 20,000+ organizations worldwide, but most importantly, by Google, SnowFlake, and nickelodeon.
Salesforce [Sales Cloud]

Sales Cloud is a comprehensive customer relationship management (CRM) platform offered by Salesforce.
Features
- Easily manage leads and opportunities by providing customizable lead and opportunity pipelines, automated lead routing, and lead scoring
- Create highly customizable dashboards to track, monitor, and analyze the sales team’s performance in real-time
- Has a built-in sales forecasting tool that helps teams to forecast their performance and create accurate sales projections
- Collaborate on sales deals and share information easily with Sales Cloud’s collaboration tools, such as Chatter, which provides real-time messaging, file sharing, and task management
Salescloud is a go-to tool for teams looking for cost-cutting without hampering productivity or results.
Klipfolio

Klpis by Klipfolio allows you to create custom sales dashboards.
Features
- Extensive library of pre-built sales metrics and custom dashboard templates to pace your dashboard creation process
- Integrates with 130+ data services; allows customer data import using REST/URL option
- Built-in Klip editor to consolidate and streamline complex data using formulas, filtering, or sorting
- Advanced customization options involving HTML template components, CSS, and Javascript
The dashboards built using Klips provides real-time access to sales data and the power to present performance via pixel-perfect data visualization elements.
Datapine

Datapine is a cloud-based business intelligence tool that offers robust sales analytics and reporting to help businesses make data-driven decisions and set the right target for sales reps.
Features
- Has an intuitive drag-and-drop interface for creating interactive dashboards and reports
- Real-time data analysis and reporting, from sales forecasting analytics to employee performance reporting
- Advanced data visualization options, such as heat maps, funnel charts, and scatter plots, help users understand their sales data better
- Automated data connectors to import data from multiple sources; easily connect datapine with Salesforce and other CRM business tools
Databox
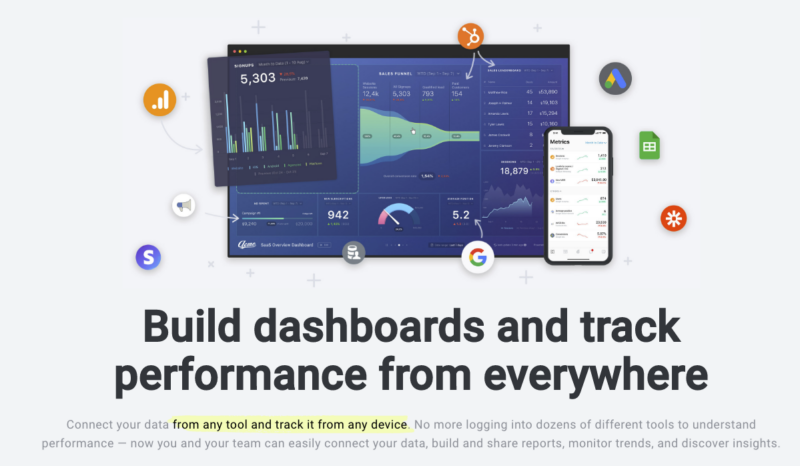
With over 20,000+ customers, Databox is a popular business analytics and dashboarding tool among marketers and sales teams.
Features
- Over 70+ native integrations, plus connections to SQL database, Zapier, and Gsheets, allowing seamless flow of data in and out
- Built-in dashboard designer tool to quickly build or create sales KPI dashboards – no code required
- Set goals and visualize progress; get automated alerts when a metric trends up or down the set threshold point
- Enable display-to-TV feature to share live dashboard on office TV screens, conferences, or team meetings
The platform also has a dedicated mobile app allowing you to track, measure, and analyze performance on the go.
SimpleKPI

As the name suggests, SimpleKPI assists sales teams in analyzing their hefty data via simple, beautiful dashboards.
Features
- Has an impressive gallery of charts, graphs, league tables, and widgets that help create easy-to-read sales dashboards
- Use drill down and up feature to analyze data at all levels; compare trends of various periods to analyze through and identify opportunities
- Goal-setting and tracking tools that enable businesses to set achievable targets and monitor progress toward them
- Report generation and sharing features that allow users to create and share reports in various formats, including PDF, Excel, and PowerPoint
SimpleKPI’s easy-to-use yet robust interface reduces the time it takes for sales managers to analyze the team’s performance.
Datapad
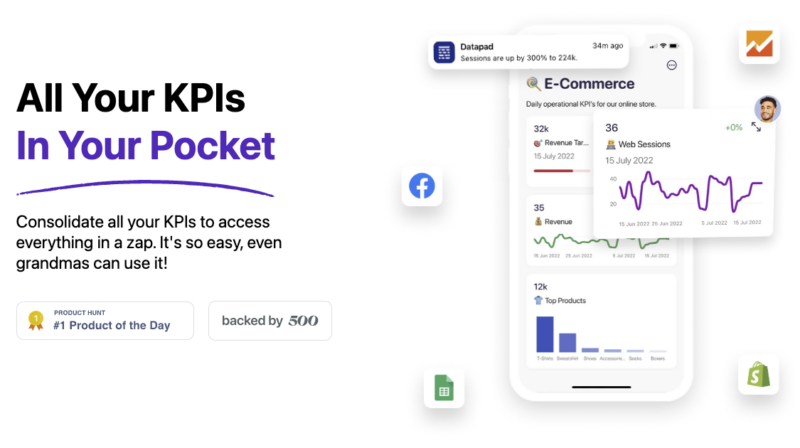
Datapad is a mobile-first KPI tracking and dashboarding platform that allows sales executives to monitor sales performance on the go.
Features
- Easy drag-and-drop customization to change the look and feel of dashboards and reports – no code required
- Integrations to popular data sources like Google Analytics, MySQL Database, Shopify, Facebook Ads, and more
- Built-in team collaboration feature assisting in real-time chat from within the app
- Set real-time alerts and push notifications for KPIs; enable role-based management to control who can view/edit dashboards.
The platform is completely free and is supported by a highly-responsive mobile app.
Wrapping Up
So, conclusively, sales dashboard tools are just about dashboards. There are a lot of features that come in handy with every tool.
We’ve covered the key features of all the tools in this article. There might be some common features, but for the most part, every tool caters to specific business needs and requirements.
And so, pick the tool that you think might help your sales team increase their working efficiency and help sales managers drill down data to find bottlenecks in the sales funnel.