Pandas is the most popular data analysis library for Python. It is used extensively by data analysts, data scientists, and machine learning engineers.
Alongside NumPy, it is one of the must-know libraries and tools for anyone working with data and AI.
In this article, we will explore Pandas and the features that make it so popular in the data ecosystem.
What is Pandas?
Pandas is a data analysis library for Python. This means it is used to work with and manipulate data from within your Python code. With Pandas, you can efficiently read, manipulate, visualize, analyze, and store data.
The name ‘Pandas’ comes from joining the words Panel Data, an econometrics term that refers to data obtained from observing multiple individuals over time. Pandas was originally released in January 2008 by Wes Kinney, and it has since grown to become the most popular library for its use case.
At the heart of Pandas are two essential data structures that you should be familiar with, Dataframes and Series. When you create or load a dataset in Pandas, it is represented as either one of those two data structures.
In the next section, we will explore what they are, how they are different, and when is using either one of them ideal.
Key Data Structures
As mentioned earlier, all data in Pandas is represented using either one of two data structures, a Dataframe or a Series. These two data structures are explained in detail below.
Dataframe

A Dataframe in Pandas is a two-dimensional data structure with columns and rows. It is similar to a spreadsheet in your spreadsheet application or a table in a relational database.
It is made up of columns, and each column represents an attribute or feature in your dataset. These columns are then made up of individual values. This list or series of individual values is represented as a Series objects. We will discuss the Series data structure in more detail later in this article.
Columns in a dataframe can have descriptive names so they are distinguished from each other. These names are assigned when the dataframe is created or loaded but can be easily renamed at any time.
The values in a column have to be of the same data type, although columns do not have to hold data of the same type. This means a name column in a dataset will store exclusively strings. But the same dataset can have other columns like age that store ints.
Dataframes also have an index used to reference rows. Values across different columns but with the same index form a row. By default, indexes are numbered but can be reassigned to suit the dataset. In the example (pictured above, coded below), we set the index column to the ‘months’ column.
import pandas as pd

sales_df = pd.DataFrame({
    'Month': ['January', 'February', 'March'],
    'Jane Doe': [5000, 6000, 5500],
    'John Doe': [4500, 6700, 6000]
})

sales_df.set_index(['Month'], inplace=True)

print(sales_df)
Series

As discussed earlier, a Series is used to represent a column of data in Pandas. A Series is, therefore, a one-dimensional data structure. This is in contrast to a Dataframe that is two-dimensional.
Although a Series is commonly used as a column in a Dataframe, it can also represent a complete dataset on its own, provided the dataset has just one attribute being recorded in a single column. Or rather, the dataset is simply a list of values.
Because a Series is simply one column, it does not need to have a name. However, the values in the Series are indexed. Like the index of a Dataframe, the dataframe of a Series can be modified from the default numbering.
In the example (pictured above, coded below), the index has been set to different months using the set_axis method of a Pandas Series object.
import pandas as pd

total_sales = pd.Series([9500, 12700, 11500])
months = ['January', 'February', 'March']

total_sales = total_sales.set_axis(months)

print(total_sales)
Features of Pandas
Now that you have a good idea of what Pandas is and the key data structures that it utilizes, we can begin discussing the features that make Pandas such a powerful data analysis library and, as a result, incredibly popular within the Data Science and Machine Learning Ecosystems.
#1. Data Manipulation
The Dataframe and Series objects are mutable. You can add or remove columns as needed. In addition, Pandas lets you add rows and even merge datasets.
You can perform numerical computations, such as normalizing data and making logical comparisons element-wise. Pandas also allows you to group data and apply aggregate functions such as mean, average, max, and min. This makes working with data in Pandas a breeze.
#2. Data Cleaning

Data obtained from the real world often have values that make it hard to work with or not ideal for analysis or use in machine learning models. The data could be of the wrong data type, in the wrong format, or it could just be missing completely. Either way, this data needs preprocessing, referred to as cleaning, before it can be used.
Pandas has functions to help you clean your data. For example, in Pandas, you can delete duplicated rows, drop columns or rows with missing data, and replace values with either default values or some other value, such as the mean of the column. There are more functions and libraries that work with Pandas to enable you to do more data cleaning.
#3. Data Visualization
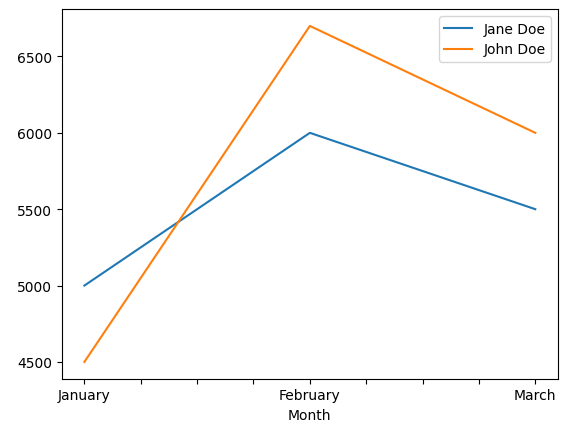
While it is not a visualization library like Matplotlib, Pandas has functions for creating basic data visualizations. And although they are basic, they still get the job done in most cases.
With Pandas, you can easily plot bar graphs, histograms, scatter matrices, and other different types of charts. Combine that with some data manipulations you can do in Python, and you can create even more complicated visualizations to better understand your data.
import pandas as pd

sales_df = pd.DataFrame({
    'Month': ['January', 'February', 'March'],
    'Jane Doe': [5000, 6000, 5500],
    'John Doe': [4500, 6700, 6000]
})

sales_df.set_index(['Month'], inplace=True)

sales_df.plot.line()
#4. Time Series Analysis
Pandas also supports working with timestamped data. When Pandas recognizes a column as having datetime values, you can perform many operations on the same column that are useful when working with time series data.
These include grouping observations by time period and applying aggregate functions to them, such as sum or mean or get the earliest or latest observations using min and max. There are, of course, many more things you can do with time series data in Pandas.
#5. Input/Output in Pandas

Pandas is capable of reading data from the most common data storage formats. These include JSON, SQL Dumps, and CSVs. You can also write data to files in many of these formats.
This ability to read from and write to different data file formats allows Pandas to seamlessly interoperate with other applications and build data pipelines that integrate well with Pandas. This is one of the reasons why Pandas is widely used by many developers.
#6. Integration with Other Libraries
Pandas also has a rich ecosystem of tools and libraries built on top of it to complement its functionality. This makes it an even more powerful and useful library.
Tools within the Pandas ecosystem enhance its functionality across different areas, including data cleaning, visualization, machine learning, input/output, and parallelization. Pandas maintains a registry of such tools in their documentation.
Performance and Efficiency Considerations in Pandas
While Pandas shines in most operations, it can be notoriously slow. The bright side is you can optimize your code and improve its speed. To do this, you have to understand how Pandas is built.
Pandas is built on top of NumPy, a popular Python library for numeric and scientific computation. Therefore, like NumPy, Pandas works more efficiently when operations are vectorized as opposed to picking on individual cells or rows using loops.
Vectorization is a form of parallelization where the same operation is applied to multiple data points at once. This is referred to as SIMD – Single Instruction, Multiple Data. Taking advantage of vectorized operations will improve the speed and performance of Pandas dramatically.
Because they use NumPy arrays under the hood, the DataFrame and Series data structures are faster than their alternative dictionaries and lists.
The default Pandas implementation runs on only one CPU core. Another way to speed up your code is to use libraries that enable Pandas to utilize all the CPU cores available. These include Dask, Vaex, Modin, and IPython.
Community and Resources
Being a popular library of the most popular programming language, Pandas has a large community of users and contributors. As a result, there are lots of resources to use to learn how to use it. These include the official Pandas documentation. But there are also countless courses, tutorials, and books to learn from.
There are also online communities on platforms such as Reddit in the r/Python and r/Data Science subreddits to ask questions and get answers. Being an open-source library, you can report issues on GitHub and even contribute code.
Final Words
Pandas is incredibly useful and powerful as a data science library. In this article, I tried to explain its popularity by exploring the features that make it the go-to tool for data scientists and programmers.
Next, check out how to create a Pandas DataFrame.